Path planning with obstacles
This example is adapted from Cederberg, Zhang, Nobel, and Boyd, “Disciplined Nonlinear Programming“.
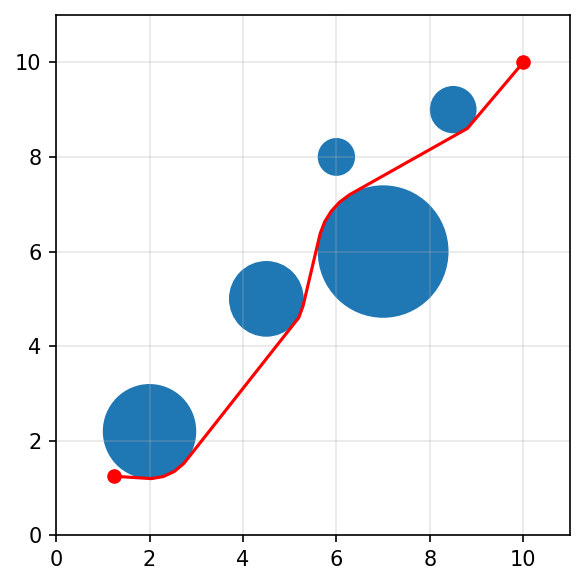
In this example, we seek the shortest path connecting points \(a\) and \(b\) in \(\mathbf{R}^d\) that avoids \(m\) circles, centered at \(p_j\) with radius \(r_j\), \(j = 1, \ldots, m\). After discretizing the arc-length-parametrized path into a sequence of points \(x_0, \ldots, x_n\), the problem can be written as
with variables \(L \in \mathbf{R}\) and \(x_i \in \mathbf{R}^d\), \(i = 0, \ldots, n\). The problem data are \(a \in \mathbf{R}^d\), \(b \in \mathbf{R}^d\), and \(p_j \in \mathbf{R}^d\) and \(r_j > 0\) for \(j = 1, \ldots, m\).
We consider a problem instance with dimension \(d\) = 2, \(n\) = 50 path segments, and \(m\) = 5 obstacles.
import cvxpy as cp

# problem data
n = 50
ell = 10
m = 5
a = np.array([[1.25, 1.25]])
b = np.array([[ell, ell]])
d = 2
p = np.array([[2, 4.5, 6, 7, 8.5], [2.2, 5, 8, 6, 9]]).T
r = np.array([1, 0.8, 0.4, 1.4, 0.5])

x = cp.Variable((d, n + 1), name="x")
L = cp.Variable(name="L", nonneg=True)
constr = [x[:, 0] == a, x[:, n] == b]
constr += [cp.sum(cp.square(x[:, 1:] - x[:, :-1]), axis=0) <= (L / n) ** 2]
for i in range(n + 1):
    constr += [cp.sum(cp.square(x[:, i] - p), axis=1) >= r ** 2]

# initialize to straight line path
x.value = (b.T - a.T) / n * np.arange(n + 1) + a.T
prob = cp.Problem(cp.Minimize(L), constr)
prob.solve(nlp=True, solver=cp.IPOPT, verbose=False)
The figure below shows the solution to this problem instance, when initialized as the straight line path from \(a\) to \(b\). For other initializations, the final path is different.
fig, ax = plt.subplots(figsize=(4, 4))
for i in range(m):
    center = tuple(p[i, :])
    circle = mpatches.Circle(center, r[i], ec="none")
    ax.add_patch(circle)

plt.plot(a[0, 0], a[0, 1], "ro", markersize=6)
plt.plot(b[0, 0], b[0, 1], "ro", markersize=6)
ax1 = x.value[0, :]
ax2 = x.value[1, :]
plt.plot(ax1, ax2, "r-")
plt.ylim(0, 11)
plt.xlim(0, 11)
ax.grid(alpha=0.3)
fig.set_dpi(150)
fig.tight_layout()